Objective
This study evaluated the impact of Dissolved Oxygen (DO) levels on microbial growth by measuring colony-forming units (CFUs) in culture solutions. Three experimental groups, each exposed to a different DO level via Kairospace Nanobubble Technology, were compared to a control group with no additional oxygen.
The goal was to compare oxygenation levels for synganic cultivation—an approach that integrates synthetic fertilizer salts with organic beneficial microbe inoculants to enhance irrigation efficiency, plant health, and nutrient absorption.
This is one preliminary run: one inoculant, one growth medium, one incubation, a single plate set per group, in a batch tank rather than in soil. A colony count measures what happens to grow on that medium under those conditions, which is a fraction of what is present — so it is a proxy for culturable proliferation and not a community profile. Three oxygen levels and a single run cannot locate an optimum or draw a dose-response curve, and the response below turns out to be non-monotonic. The follow-up named in the conclusion — 16S rRNA sequencing and ATP assays — is the work that would settle what changed in the community.
Materials and Methods
Materials
- Inoculant Solution: GreenGro MadRoots All In One + Green Aminos
- Treatment System: Kairospace AGPACK 40 (Nanobubble Generator)
- Analysis Software: OpenCFU AI (Automated Colony Counting)
- Lab Equipment: Sterile saline, Nutrient agar plates, Incubator (37°C), Sterile micropipettes.
Experimental Setup
We established three distinct test groups based on oxygenation levels:
- Control Group: Ambient DO (8 ppm) – No treatment.
- Test Group 1: High DO (24 ppm) – Nanobubble treated.
- Test Group 2: Medium DO (12 ppm) – Nanobubble treated.
Procedure
- Serial Dilution: 1 mL of culture solution was diluted in sterile saline steps (10-1; 10-2; etc.) to ensure countable colonies.
- Plating: 1 mL of each dilution was spread onto nutrient agar plates.
- Incubation: Plates were incubated at 37°C for 24-48 hours.
- Counting: Colonies were counted using OpenCFU software (range 30-300 colonies per plate).
Results and Calculations
The following table details the observed colony counts and chemical parameters for each group.
| Group | DO Level | pH | EC | CFU Count | Dilution |
|---|---|---|---|---|---|
| Control | 8 ppm | 5.6 | 3.2 | 91 | 10-2 |
| Test Group 1 | 24 ppm (High) | 5.6 | 3.2 | 127 | 10-2 |
| Test Group 2 | 12 ppm (Med) | 5.6 | 3.2 | 242 | 10-2 |
If the table is wider than the screen, scroll horizontally.
*CFU calculation based on dilution factor 10-2; and plated volume of 1 mL.
Analysis and Observations
1. High Dissolved Oxygen (24 ppm) – Oxidative Stress?
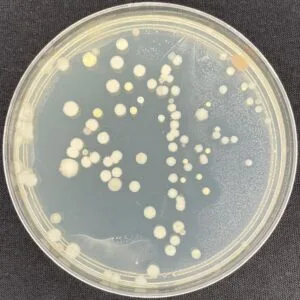
CFU Count: 12,700
This group showed substantial growth but less than the 12 ppm group. The colonies were predominantly medium-to-large.
Interpretation: While oxygen supports proliferation, the highest level tested returned fewer colonies than the middle one, so the response did not keep rising with oxygen. One reading consistent with that is oxidative stress — an environment that favors oxygen-tolerant organisms while limiting obligate anaerobes or sensitive beneficials. A CFU count on a single medium cannot confirm it: fewer colonies here is a lower culturable count, not a measured change in community composition.
2. Medium Dissolved Oxygen (12 ppm) – The Highest Count of the Three
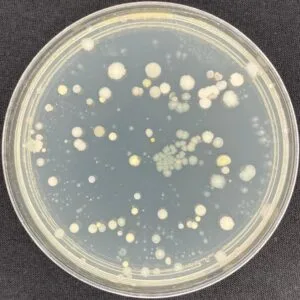
CFU Count: 24,200 (Highest of the three levels tested)
This group produced the highest count and the widest spread of colony sizes on the plate (small, medium, and large).
Interpretation: Of the three levels tested, 12 ppm produced the most culturable growth, and the range of colony sizes was widest. Colony morphology on one medium is suggestive of a community changing shape — it is not a measurement of functional diversity, which would need 16S rRNA sequencing. Nor does the highest of three points make 12 ppm an optimum: three levels and one run do not locate one.
3. Control Group (8 ppm) – Limited Potential
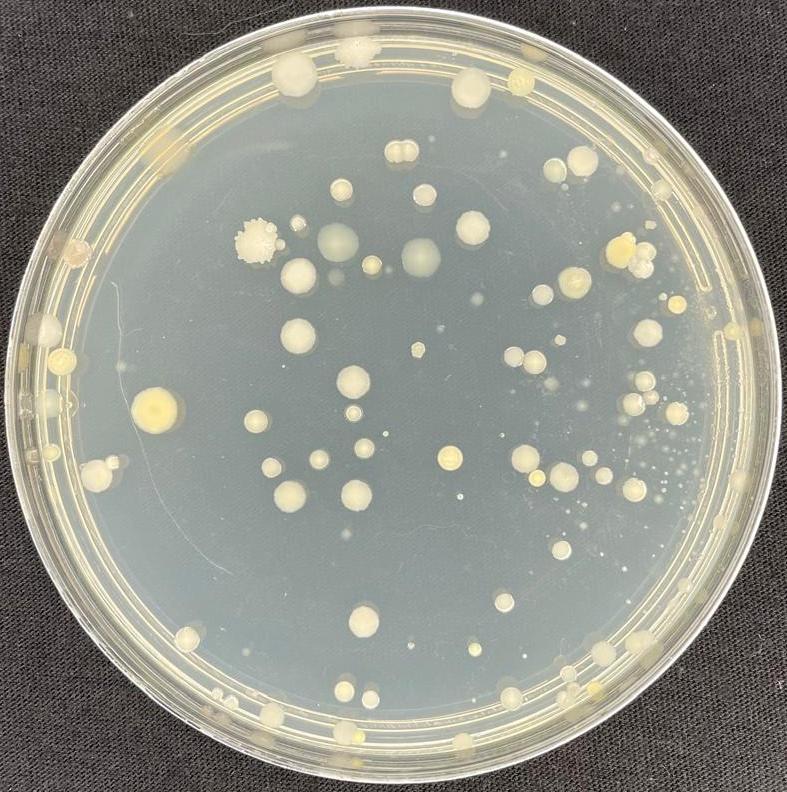
CFU Count: 9,100 (Lowest of the three levels tested)
Predominantly large colonies were observed, with an absence of smaller, fast-growing species.
Interpretation: Lower oxygen availability appears to limit the expansion of facultative aerobes, leaving the plate dominated by slower-growing colonies. On this medium the control produced both the fewest colonies and the narrowest range of colony sizes. That is a statement about what grew on one plate under one set of conditions, not about the structure of the microbiome as a whole.
Conclusion
This preliminary run shows that dissolved oxygen changed both the number of culturable colonies and the range of colony sizes on the plate. The change was not proportional to oxygen.
- High DO (24 ppm) produced more growth than the control but fewer colonies than 12 ppm — the count did not keep rising with oxygen.
- Medium DO (12 ppm) produced the highest count of the three levels tested, and the widest range of colony sizes. That is not the same as an optimum; three points and one run cannot locate one.
- Low DO (8 ppm) produced the lowest count, favoring slow-growing colonies.
Because the highest level tested returned fewer colonies than the middle level, the safe summary of this run is that the community reorganized rather than simply growing.
View data and conditions
| Group | CFU/mL |
|---|---|
| 8 ppm | 9,100 |
| 12 ppm | 24,200 |
| 24 ppm | 12,700 |
If the table is wider than the screen, scroll horizontally.
Future Research: While CFU counts measure proliferation, future studies will incorporate 16S rRNA sequencing and metabolic assays (ATP quantification) to map the specific functional shifts in these communities.
Context: Why Synganic?
Synganic cultivation combines the precision of synthetic salts with the biological benefits of organic inputs. However, organics require oxygen to breakdown and become bioavailable.
Typically, inoculants are brewed using "Airlift" systems. What this run tested is nanobubble recirculation as a way to set and hold a chosen DO level in a batch tank — 8, 12 and 24 ppm were each reached and held. It does not establish that one level is better than another for the root zone, and it does not measure disease resistance or nutrient cycling at all. What it shows is that the level chosen changes the culturable population, and that more oxygen was not simply better.